First chart shows the 5 year weekly chart of $SPX from 2006-present with some simple 50 and 200 period SMA's. The highlighted rectangles are what I am focusing on. Notice each top clearly shows a bull trap above previous highs and classic 6 month head and shoulders rounding formations which led to longs being trapped with plenty of supply overhead.
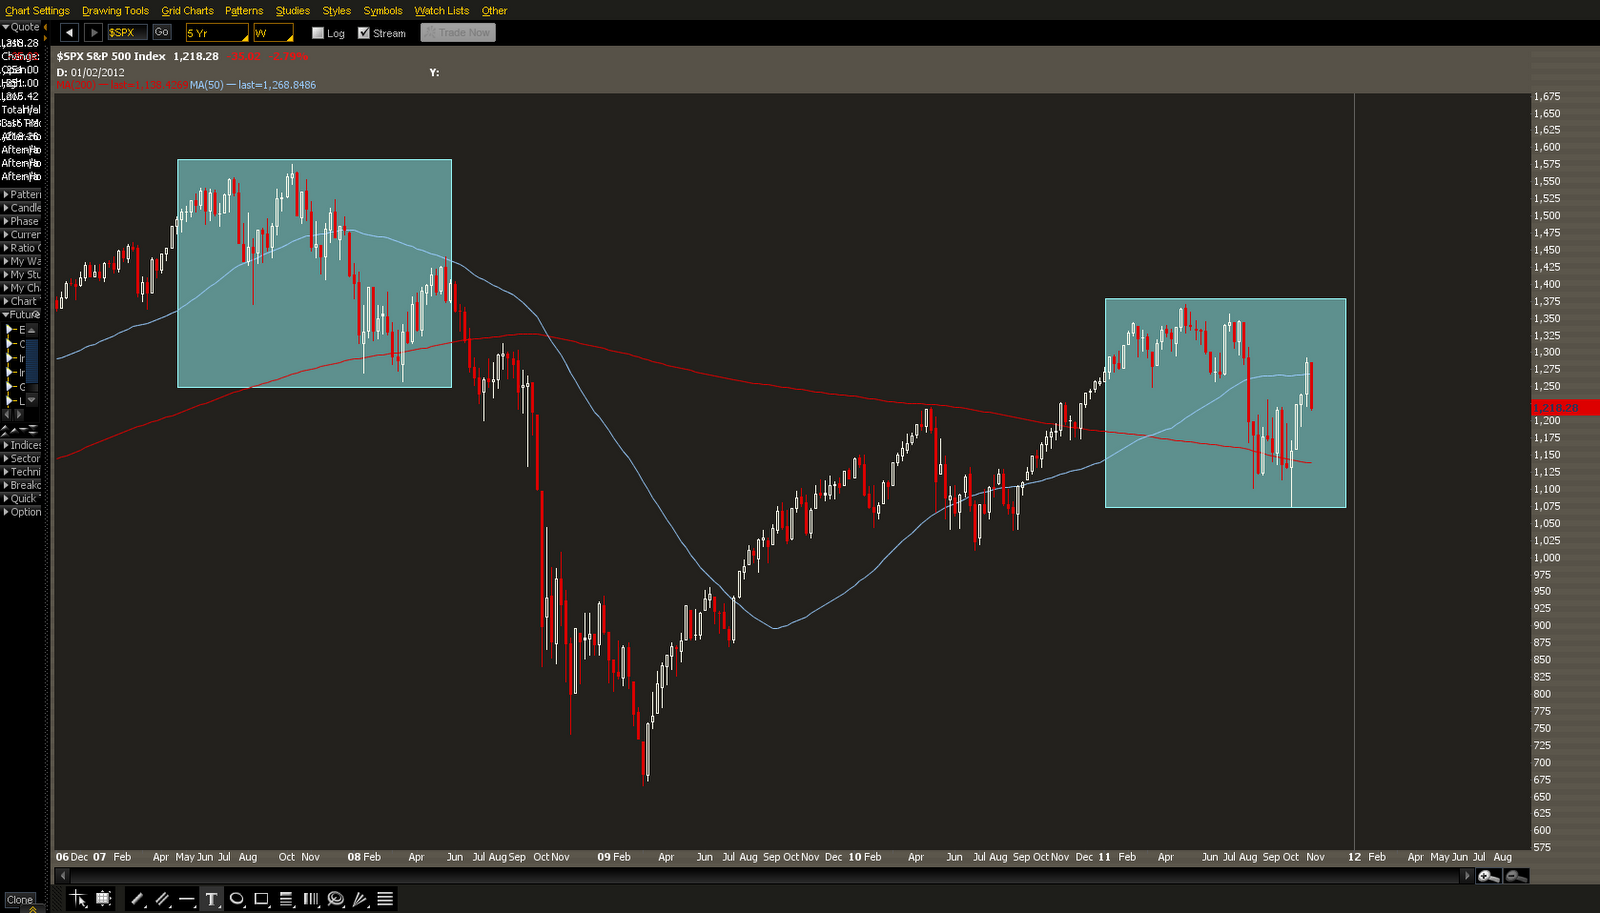
- 2007-08: The Oct 11th high of 1576 to the March 17th low of 1256 was a decline of 20.3%
- 2011: The May 2nd high of 1370 to the Oct 4th low of 1074 was a decline of 21.6%
Fairly equal percentage moves right?
Here is where it gets nutty.
- Each decline from high to low lasted a total duration of 23 weeks.
- Each decline found support and eventually bounced off the 200 week SMA
- Both price lows were bear traps which undercut the previously made lows. In 2008 it was the March 17th "Bear Stearns" low.
- Both of the subsequent rallies up were stopped at resistance at the 200 day SMA. In 2008 at a level of 1440 and 2011 at a level of 1292 SPX.

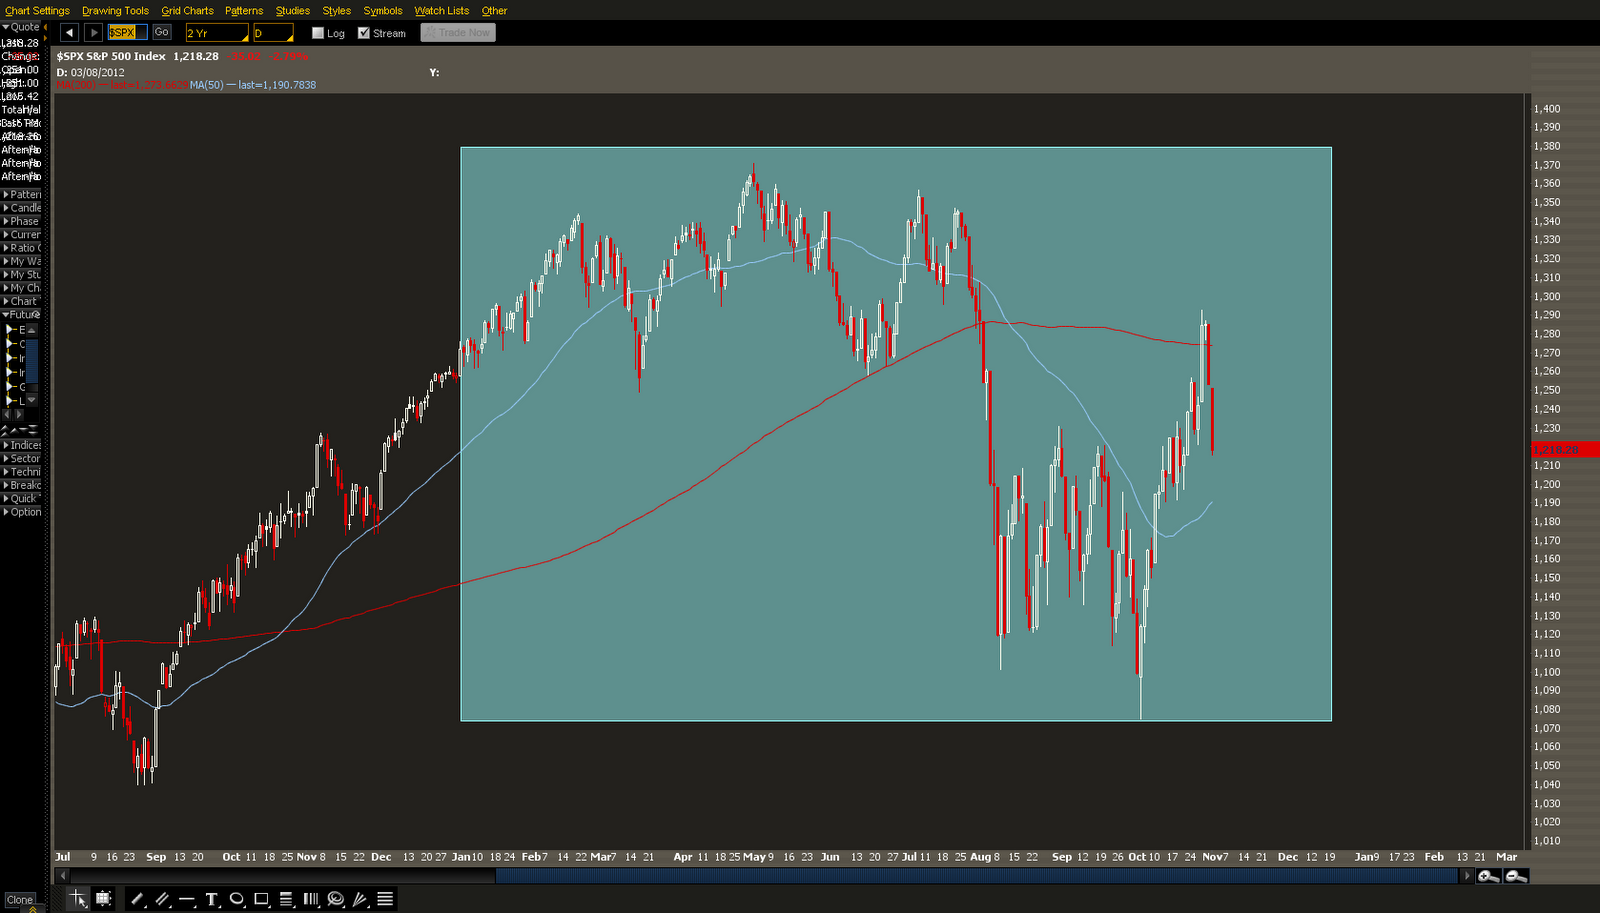
As the 2nd and 3rd charts show there are a few key differences as well.
- In 2008 the slope of the 200 day SMA was pointing much sharper down than it currently is. However it is still pointed slightly down in the present 2011 market.
- The rally back up off the lows was faster and sharper in 2011 than in Spring 2008.
Even so, I think its been interesting to keep an eye on the similarities between this analog chart and the present markets. History repeats itself because human nature is constant. I think this is even more significant because we have just had a 5 wave up bull market for the past 2.5 years and the long term investor sentiment is clearly bullish in the "acceptance" stage.
Remember the technical's move far before the "data" confirms reality because the market is the smartest in the room.
Simply ignore the outside noise and media and focus in on the pure price action. Clearly, it is not 2008. It is 2011. But like in the 1930's when the "great recovery" began, the government interfered and helped welcome the double dip recession of 1937-38. The public is losing confidence in the leaders as shown by the Occupy movement. A lot of the same ingredients are in place at this time so is the market predicting the same fate? We shall see over the next year!
No comments:
Post a Comment