Wednesday, November 2, 2011

Euro Gets Stopped at the 61.8% Retracement

The short covering rally in the EUR/USD since October ran up about 1000 pips and got stopped cold right at the 61.8% retracement of the larger downtrend in place since May 2011. Pretty amazing how these fibonacci levels work in the markets, especially currencies. The 1.4250 level has been a huge level of interest for the past year as this was where the Euro topped out in late 2010 and then found support throughout mid-2011 as the currency made a major top before falling to 1.3145.


Now after the bounce back to resistance it failed and slipped back below the 200 EMA which sits at 1.3955 on the daily. The daily chart has flipped back to a short term sell signal based on the color of my TTM trend bars and if it doesn't recover the 1.4000 zone soon it should continue a multi-month decline. 


This is even more significant based on the fact that the weekly chart is possibly forming the right shoulder of a bearish head and shoulders top with the slanted neckline shown below coming in near 1.3400.


This definitely depends on the direction of the dollar as well but I think in the intermediate term there are more downside risks to the Euro than the US buck. It will be interesting to see where the Euro goes into year end but last week's blowoff top at 1.4250 has all the makings of a important high that we might look back at in 3-6 months. If it does actually breakdown I can see the EUR/USD at 1.25 to 1.2750 very easily as initial targets.

Tuesday, November 1, 2011

Fascinating Similarities Between 2008 and Now

There are some crazy interesting similarities in price action between the present market and the early 2008 patterns of price. So I went back to compare the analog chart between then and now. I trade in the short term but I always have a view of the big picture. Just wanted to point out the possibilities of where the stock market might go in the intermediate term-long term. 

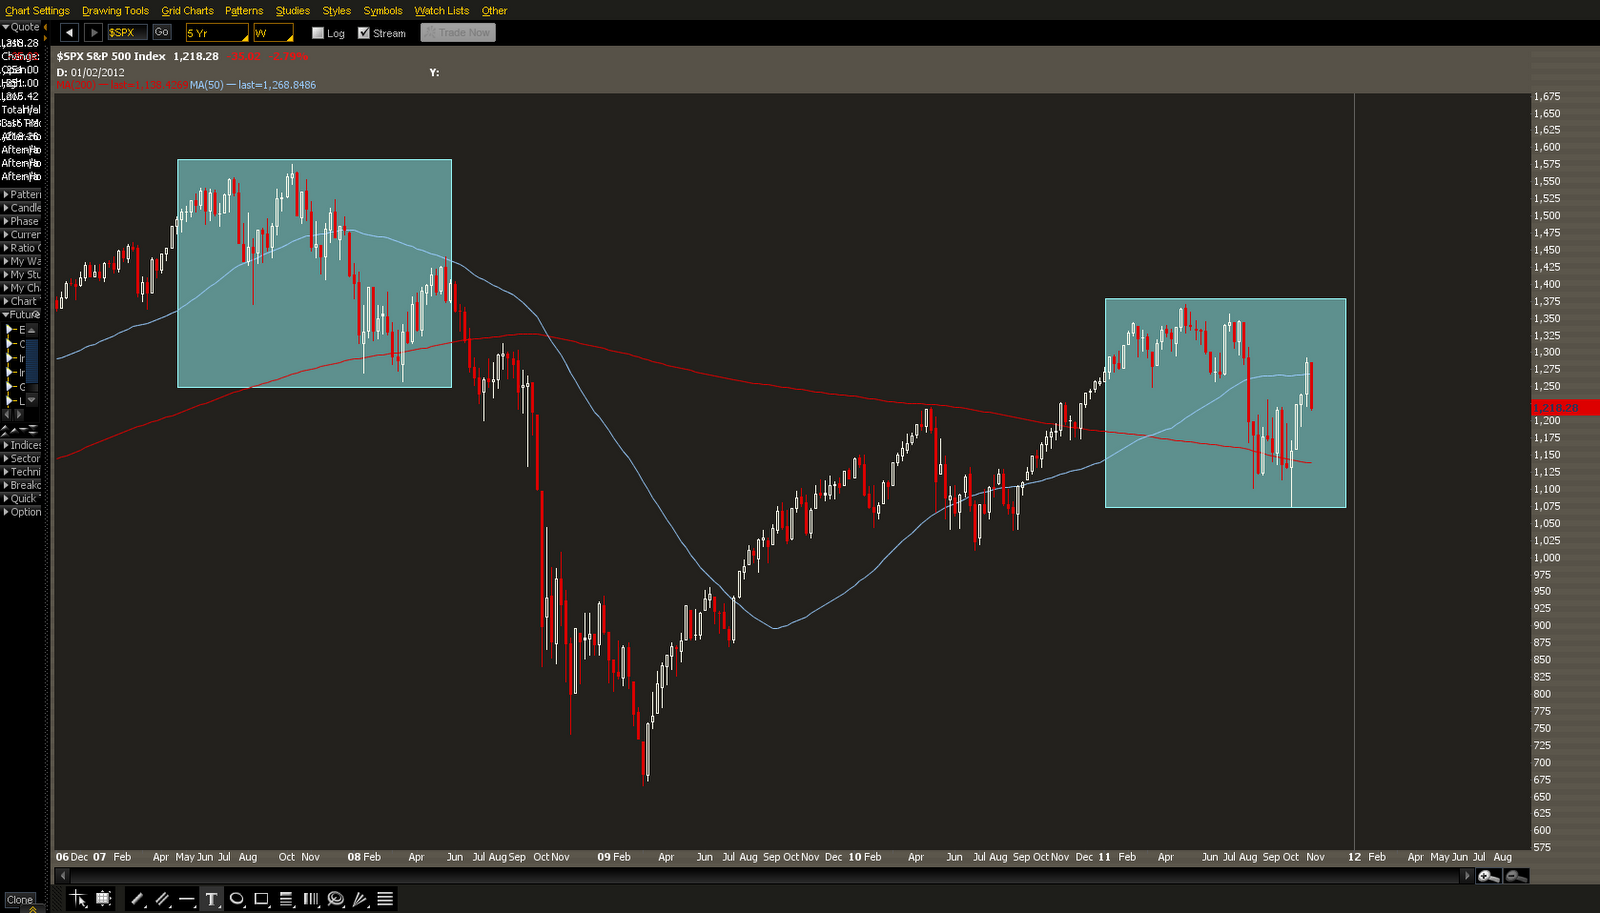
First chart shows the 5 year weekly chart of $SPX from 2006-present with some simple 50 and 200 period SMA's. The highlighted rectangles are what I am focusing on. Notice each top clearly shows a bull trap above previous highs and classic 6 month head and shoulders rounding formations which led to longs being trapped with plenty of supply overhead.


  • 2007-08: The Oct 11th high of 1576 to the March 17th low of 1256 was a decline of 20.3%
  • 2011: The May 2nd high of 1370 to the Oct 4th low of 1074 was a decline of 21.6%

Fairly equal percentage moves right?

Here is where it gets nutty.

  • Each decline from high to low lasted a total duration of 23 weeks.
  • Each decline found support and eventually bounced off the 200 week SMA
  • Both price lows were bear traps which undercut the previously made lows. In 2008 it was the March 17th "Bear Stearns" low.
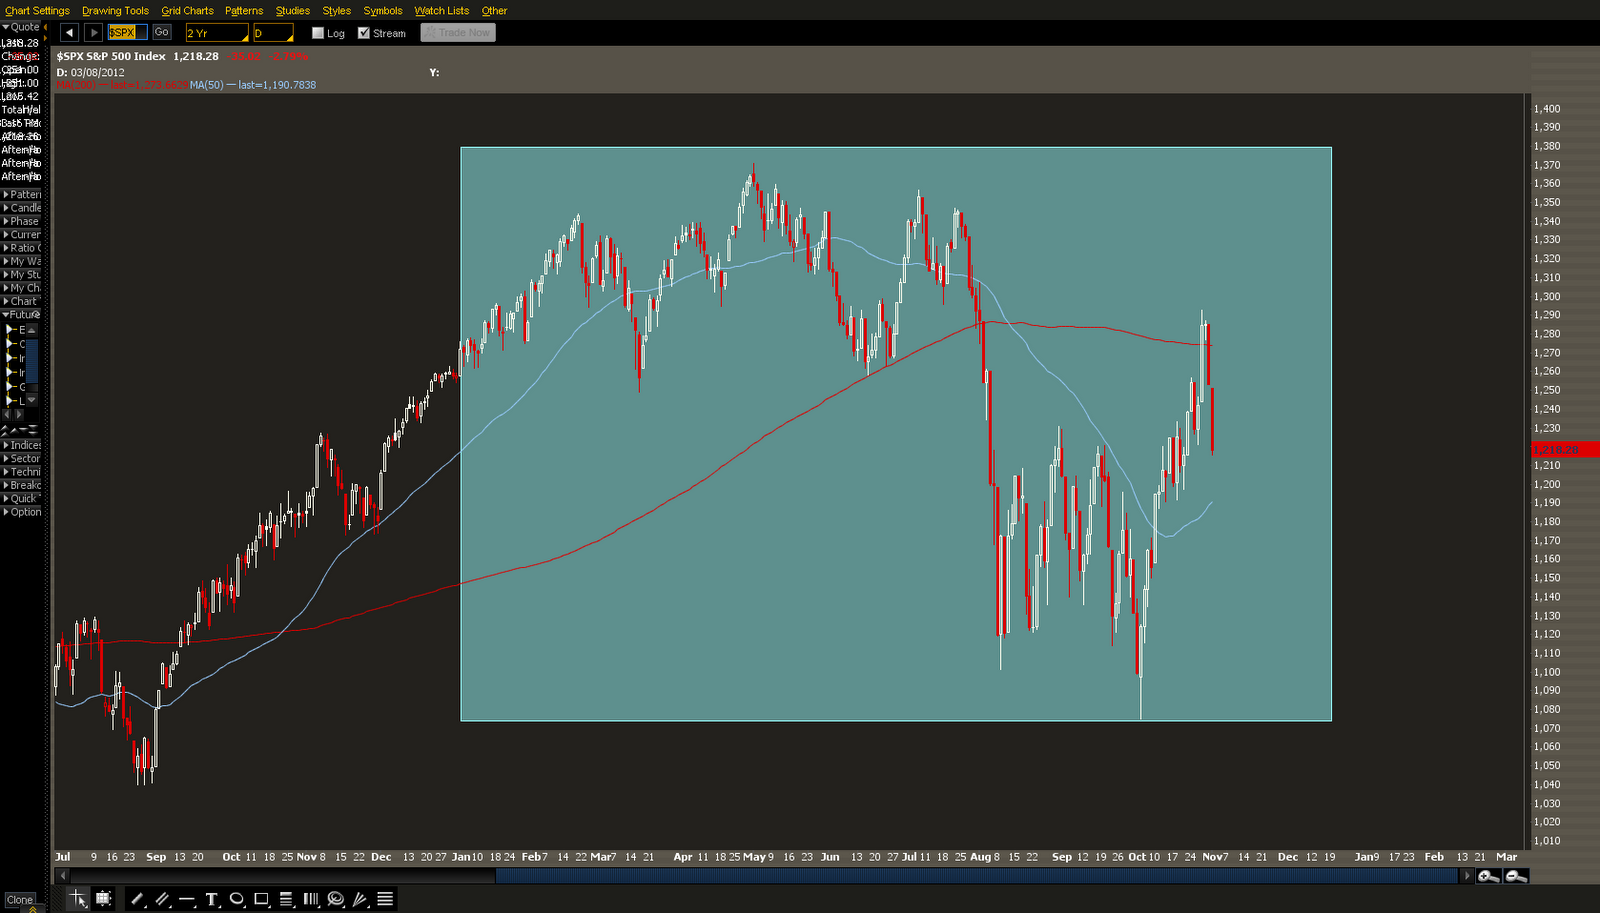
  • Both of the subsequent rallies up were stopped at resistance at the 200 day SMA. In 2008 at a level of 1440 and 2011 at a level of 1292 SPX.


As the 2nd and 3rd charts show there are a few key differences as well.

  • In 2008 the slope of the 200 day SMA was pointing much sharper down than it currently is. However it is still pointed slightly down in the present 2011 market.
  • The rally back up off the lows was faster and sharper in 2011 than in Spring 2008.

Even so, I think its been interesting to keep an eye on the similarities between this analog chart and the present markets. History repeats itself because human nature is constant. I think this is even more significant because we have just had a 5 wave up bull market for the past 2.5 years and the long term investor sentiment is clearly bullish in the "acceptance" stage.

Remember the technical's move far before the "data" confirms reality because the market is the smartest in the room.

Simply ignore the outside noise and media and focus in on the pure price action. Clearly, it is not 2008. It is 2011. But like in the 1930's when the "great recovery" began, the government interfered and helped welcome the double dip recession of 1937-38. The public is losing confidence in the leaders as shown by the Occupy movement. A lot of the same ingredients are in place at this time so is the market predicting the same fate? We shall see over the next year!

Saturday, June 25, 2011

Trading Grains (Part 4): Managing Risk with ATR

To close out the mini-series of Trading Grain Futures I want to focus a bit on managing risk and how to maximize profit targets. When it comes down to it if you're not managing the risk on a trade you will not be around very long. When trading, my goal right off the bat is to know where I'm getting out in case I am wrong. I obviously take a trade because it shows me a high probability of making money but my focus is always the risk involved.Your job as a trader should be to always manage the risk to an acceptable amount related to your tolerance and account size. The winners then take care of themselves. 


So after discussing some of the ways I trade and analyze corn and the other grains futures in Parts 1-3 of Trading the Grains lets finish out this series with how I use the ATR to manage risk. The ATR is the average true range and I like to watch it on a number of markets and stocks to see how far a move can go. The ATR is a dynamic way to measure volatility in a constantly changing market.

I always use hard stops in the futures markets and usually get into a corn day trade with a fixed stop of 10 ticks or 2.5 points. I try to get into day trades with very precise entry points but still like to give my trades some room to wiggle and develop. Sometimes the volatility is so high you need to have wider stops and targets so how do I quickly decide on this in a fast moving market?

The ATR. I watch the 60 minute chart of corn as pictured below and here was today's action. The ATR was 5.22 which means the average price range of the last 14 candles was 5.22 points. This usually is between 4-6 points on the 60 minute corn chart. So you can either use a stop equal to the ATR or use a more precise entry and have a stop of half the ATR.

With this ATR I like to target a profit of 1 times the ATR on the trade so in this case I would be looking for a profit of 5.25 points in corn or 21 ticks. If you trade more than one lot you can take half off at 1 times the ATR and look for a move of 2 times the ATR on the rest of the position with a breakeven stop once the first target is hit. 

These are just a few of the ways I like to use ATR to manage risk and look for profit targets in the grains futures. And of course you can apply this to any futures contracts or stocks on any timeframes.

Trading Grains (Part 3): The Box Play

In my previous post on grains I talked about limit moves and how to play them. In Part 3 of this series on trading the grains let's take a look at The First Half Hour Range and how to capitalize on this momentum trade using the Box Play.

Between the pit session open at 10:30 am EST and 11am EST alot of volume and activity occurs in the grains futures. Orders come in from all over the place as farmers hedge their production, commodity funds initiate positions, and speculators try to scalp the volatility in price action. The volume calms down after that first half hour but because there was so much activity it means there are plenty of positions that are open. Once the first half hour range breaks either up or down the momentum takes over and carries the market in that direction usually for the remainder of that day.

I've noticed this works best in corn and soybeans and less in wheat, which is a quirky market compared to corn and beans. After 11am EST each day I label the first half hour high and low with a horizontal line on my chart. If the first half hour range is not broken by 1:45 pm EST it usually means its a rare choppy slow day in the grains so I stay away and pass on the trade.

You can enter this trade in a few ways:
  • Either watch for a break of the high or low and take the next trade signal you use in that direction of the breakout/breakdown. This for me would be looking for a TTM Squeeze setup or a wave crossover on the TTM wave.


  • Or just simply place a buy stop above the high and a sell stop below the low of the first half hour range and walk away. If it breaks the highs you are long with an open target and the sell stop now becomes your stop on the trade. You can either target a move the equal distance of the first half hour range or just come back at 2pm EST before the grains close and flatten the position. If you have a wider tolerance for risk this becomes a nice simple way to play the range break or "The Box Play."

Here are a few examples of the Box Play in corn and soybeans.

In this first chart of corn from April 12th you can see the break below 758.25 triggered a big move down very quickly which you could have shorted and netted 9 points before the TTM trend turned back to two blue bars. 


In the 2nd chart we have soybeans on May 3rd. The dashed horizontal lines show the first half hour range. The break below the low at 1369 triggered a flurry of selling that dumped beans 15 points in less than an hour. Even if you waited til the close to cover your short you still would have booked about 7 points from 1369 to 1362. 


Limit Moves in the Grains (Part 2)

We had a sweet limit down move in corn futures today so its a perfect time to highlight limit moves in grains and show you how I traded the action today!

One of the most interesting aspects of the grain futures is the frequency and power of daily limit moves in price. Drier than expected weather in Iowa cornfields can move the price of corn violently. A freak thunderstorm in the plains can make wheat rally hard. Soybeans can tank or rise with the fluctuation of oil prices intra-day. All this and more can make forced liquidation an exciting trading opportunity in the grains futures, both on the way up and down.

As I described in "Part 1" of Trading the Grains, corn, wheat, and soybeans are a true momentum market in which the pit session is open from 10:30 am EST-2:15 pm EST. Here are some of the basic specs of contract months and LIMIT price rules:


  • Corn Futures Months traded: March (H), May (K), July (N), September (U), December (Z).
    • Daily price limit of 40 cents or "points" expanded to 60 cent limit the day after the market closes at limit.
  • Soybeans Futures Months traded: January (F), March (H), May (K), July (N), August (Q), September (U), November (X).
    • Daily price limit of 70 cents or "points" expanded to 105 cent limit the day after the market closes at limit.
  • Wheat Futures Months traded: March (H), May (K), July (N), September (U), December (Z).
    • Daily price limit of 60 cents or "points" expanded to 90 cent limit the day after the market closes at limit.
The important thing to know when trading on volatile days where limit moves are possible is to NEVER fade the trend. Ever. If you do then you risk getting stuck in a limit move that closes locked limit and opens up gapping huge in your face the next day. You could get a margin call, not to mention a sleepless night in which you will quickly develop a close personal relationship with Jesus, praying that the market comes back in your direction, lol.


So how do you trade limit moves?

Let's use corn as an example. The daily price limit is now 40 points these days so if we get a move of 30+ points during the day it becomes a very high probability that corn will test the limit of 40 points. I like to call it the "Magnet trade" because once you get that close to limit you have margin clerks and poor folks on the wrong side of the trade liquidating their longs (if its a limit down move) or their shorts (on a limit up).

Also, when it hits LIMIT and comes off that limit maybe back to only down 30-35 points on the day to consolidate a little, then you almost ALWAYS see that limit retested by the end of the day. So you want to stick with the power of the trend and forced liquidation. Its a true magnet trade!

Finally, here is a 333 tick chart of corn today. I originally planned on taking the day off from trading but then looked at my phone after about 9am PST and saw corn was down 23 handles, lol. So I raced to my computer to see if I can get a piece of the action expecting a possible limit down! The perfect entry on the short side would have been on the break of the "first half hour range" as shown by the white rectangle and arrow below. If I was at my desk I would have shorted corn as the TTM squeeze fired off near 750 and corn tanked 20 points in less than a half hour.


The vertical white line shows when I got to my computer. You can see corn was down about 23 points and so I immediately started looking for a short entry. No squeeze showed up here but with the TTM wave (bottom blue indicator) below zero so I waited for a red TTM trend bar to switch from blue.

I shorted 735.50 and put in a 3 point stop at 738.50. My target was the limit down price of 729.25. Corn started to fall back towards the lows and I got filled about 20 minutes later for +6.25 points or $312.50 per contract.

When limit down was hit there was about 100 contracts on the bid and over 100,000 on the offer panicking to sell at limit down. Its pretty amazing at the power of forced liquidation when it occurs as traders and big funds are literally willing to get OUT at any price.

Trading Grain Futures (Part 1)

I wanna do a series of posts on trading the grains futures; corn, soybeans and wheat. I think the grains offer up the most amount of opportunity than almost any other futures contracts out there. In this post I will highlight the basics you need to know and the specs between the different contracts. Corn and soybeans specifically are the two that I focus on day trading the most for several reasons. And don't worry you wont get delivery of 5000 bushels of corn in your driveway if you trade it.

So why trade corn instead of, say, the ES or other stock index futures?


  • The grains are a true momentum market in which once they pick a direction they trend in that direction for quite a while without many fake outs or bull/bear traps at highs or lows. In other words, you can buy breakouts and sell breakdowns without worrying about trend reversals. The moves made in corn or soybeans are very trendy and smooth, allowing a trader to stay in for the big move that often comes while still being able to manage risk.
  • The pit session is open from 10:30 am EST-2:15 pm EST. So if you don't like long hours then this market is for you! There is also an overnight session that runs until 8:30 am EST each morning then closes for two hours but I just focus on trading the pit session and usually you can count on some great moves occurring in just the first hour or two.
  • The daily ATR (average true range) for corn currently is 22. This means on average it moves 22 points per day, or about 3%. Soybeans have a current daily ATR of 28 or about 2%. Compare this with the ES e-mini contract ATR of 16 points or 1.2% and you can clearly see the added volatility in the grains. And where there is volatility, there is OPPORTUNITY.
  • There is basically one USDA crop report per month. That's it. You don't have to constantly await new economic data coming out and try to anticipate the market's reaction to it. Just trade the trend. The trading is great on these crop report days as you often see limit moves up or down in price. I will get into price limits another time.

The tick increments for corn, wheat and soybeans are $12.50 per quarter point ticks or $50 per point. So the same as the ES mini futures. The intraday and overnight margins are also very low for corn and just a bit higher for beans and wheat. For example, corn has a margin of just over $2,000 per contract and if you have a good futures broker you can get intraday margins of just $500 per contract.

Now that we got some of the basics out of the way let's look at a real trade example from last month to highlight my strategy. My strategy is trend following and follows the concepts I discussed in my previous post you can read here. 

I usually trade corn off a 233 or 333 tick chart and get my big picture view off the 60 minute chart. So if the 60 minute is bullish and rising then I focus on buy setups to go long and vice versa. I almost never fade the trend of the 60 minute chart in corn and there is a simple reason. Trends in the grains can last longer than you can imagine. That's why daily limit moves in price happen so often.

So in this trade from 3/25 you can see the corn market was trending up and the lower TTM wave is all above the zero line and blue so I am focusing on buying. When the squeeze indicator pops up as shown by the arrow, I already know the trend is up so I am looking for the trend bars to change back to blue to indicate the uptrend is resuming. 


This trade starts at the red vertical line. I go long corn at 690 and within a half hour I sell it at 695 when I see two red trend bars in a row. A net profit of +5 points or $250 per contract. 

Instead of trying to over-think things and attempting to catch tops or bottoms I just let the market price action tell me when the buying or selling pressure is changing. Sometimes that means you get stopped out for breakeven or even a loss, other times it means you catch a nice runner of 10+ points in the grains.

Wednesday, June 1, 2011

How I Trade The Trend

I day trade the grain futures, specifically corn; and I swing trade options on big liquid momo stocks such as AAPL. So what's my trading strategy? I'm a student of price action and market sentiment and work off of that. I like to keep it as simple as possible because complexity breeds confusion. When it comes to indicators there are only a select few I put my money behind and they are the TTM trend, TTM squeeze, and TTM wave indicators developed by John Carter, who I have learned a ton from over the last few years and highly recommend his book Mastering the Trade for anyone trying to make this a career. Anyway, how do I use these indicators to develop a trading strategy?

Simple as 1, 2, 3...


First, the TTM trend is just the color of the candles or bars you see in the charts. Either blue or red. You can see that once the color changes it tends to stay in a decent trend for awhile until things change. Each candle incorporates the close of the previous 6 periods in order to get an idea of what the actual TREND in the market is, which for me is valuable and much more important then the look or close of one candlestick.

Second, the TTM squeeze is the momentum bars with occasional red dots appearing on the midline. When they appear it tells you the stock or market is resting and getting ready for its next move so get ready!

Third, the TTM wave is the bottom indicator that shows two different wave's. A blue wave that shows the longer term momentum and a shorter term red/yellow wave. The blue wave is a filter for me to keep me on the right side of the market. For example, if the long term blue wave is completely positive then I am only looking for long setups and will buy the next time the shorter term yellow wave crosses back above 0.

All of these TTM indicators are available for free on ToS under studies.

Here is a real 60 minute chart example of a trade I took on AAPL about 2 weeks ago. AAPL had been underperforming a strong market that week so on Friday after it gapped up above 350 only to fade and then turn red on the day I was looking to go short.


1. Arrow one shows when AAPL broke 348 support the TTM trend changed to red looking at lower timeframe's like the 15 minute chart I scaled into some in-the-money 355 puts.

2. Arrow two shows the 60 minute squeeze forming on AAPL for several days saying that  move is coming. Once it breaks support at 348 and the TTM trend bars are red I can assume the squeeze will eventually fire off short.

3. Arrow three shows my last confirmation of the TTM wave red bars going negative and then the wave completely below 0. Indicating game on and I added to my 355 puts Friday before the close.

I stayed with the trade until AAPL gapped down on Tuesday morning and opened at 336. I could have waited for two blue bars in a row to show me the change in trend but I covered the AAPL at 336 that morning because 12 points in two trading days is a great move!

I do this on basically any timeframe with any stock or market. Rinse and repeat and follow the trend.